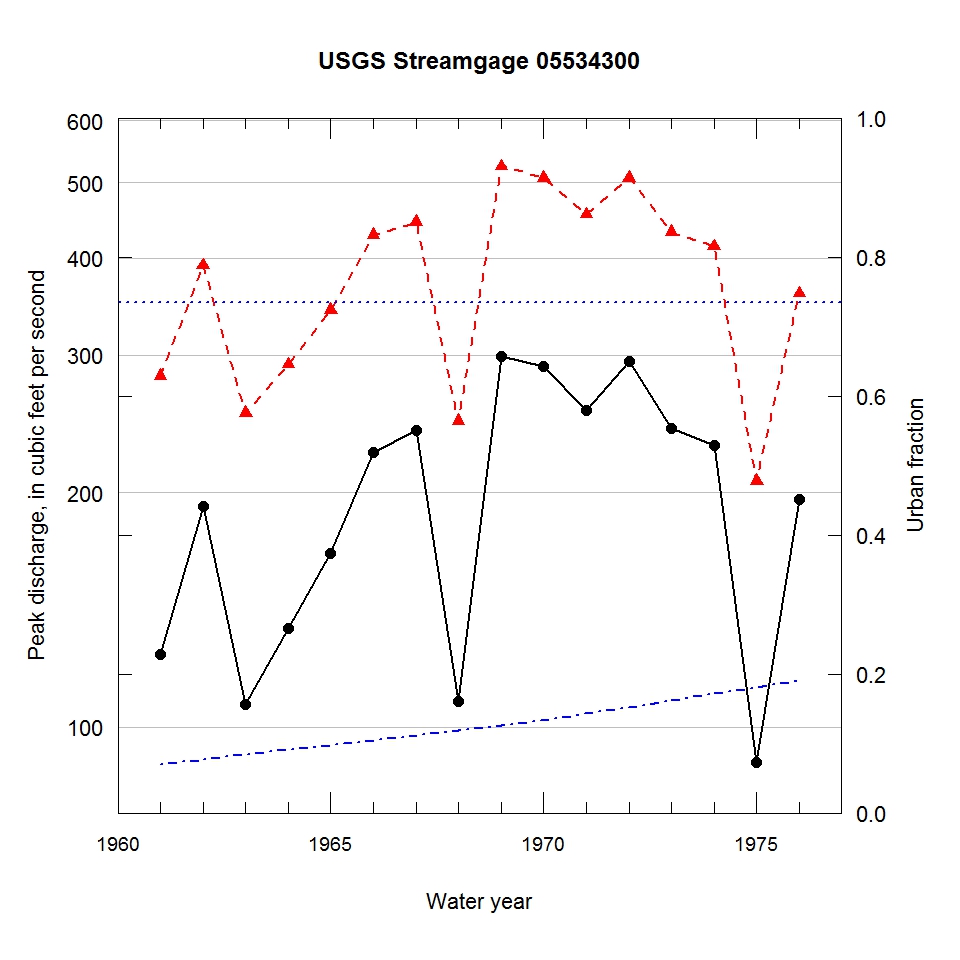
Observed and urbanization-adjusted annual maximum peak discharge and associated urban fraction and precipitation values at USGS streamgage:
05534300 NORTH BRANCH CHICAGO RIVER AT LAKE FOREST, IL


| Water year | Segment | Discharge code | Cumulative reservoir storage (acre-feet) | Urban fraction | Precipitation (inches) | Observed peak discharge (ft3/s) | Adjusted peak discharge (ft3/s) | Exceedance probability |
| 1961 | 1 | -- | 0 | 0.070 | 1.144 | 124 | 282 | 0.696 |
| 1962 | 1 | -- | 0 | 0.077 | 0.211 | 192 | 391 | 0.408 |
| 1963 | 1 | -- | 0 | 0.084 | 1.445 | 107 | 253 | 0.775 |
| 1964 | 1 | -- | 0 | 0.091 | 0.833 | 134 | 292 | 0.667 |
| 1965 | 1 | -- | 0 | 0.098 | 0.178 | 167 | 343 | 0.527 |
| 1966 | 1 | -- | 0 | 0.105 | 0.587 | 225 | 428 | 0.324 |
| 1967 | 1 | -- | 0 | 0.112 | 0.963 | 240 | 445 | 0.286 |
| 1968 | 1 | 2 | 0 | 0.119 | 0.386 | 108 | 247 | 0.790 |
| 1969 | 1 | -- | 0 | 0.126 | 2.806 | 299 | 524 | 0.172 |
| 1970 | 1 | -- | 0 | 0.133 | 2.285 | 290 | 507 | 0.188 |
| 1971 | 1 | -- | 0 | 0.143 | 0.311 | 255 | 455 | 0.267 |
| 1972 | 1 | -- | 0 | 0.152 | 3.948 | 295 | 507 | 0.188 |
| 1973 | 1 | -- | 0 | 0.162 | 1.589 | 242 | 432 | 0.313 |
| 1974 | 1 | -- | 0 | 0.172 | 1.445 | 230 | 414 | 0.354 |
| 1975 | 1 | 2 | 0 | 0.181 | 1.398 | 90 | 207 | 0.880 |
| 1976 | 1 | -- | 0 | 0.191 | 2.210 | 196 | 360 | 0.485 |

